About
This dashboard summarizes what was learned during a specialized course on PowerBI from Udemy.
Business Intelligence Fundamentals with Power BI - ETL in Power Query, DAX Formulas, Data Analysis with Dashboards
The final result is almost identical to that of the instructor since the idea was to follow his actions step by step.
Topic
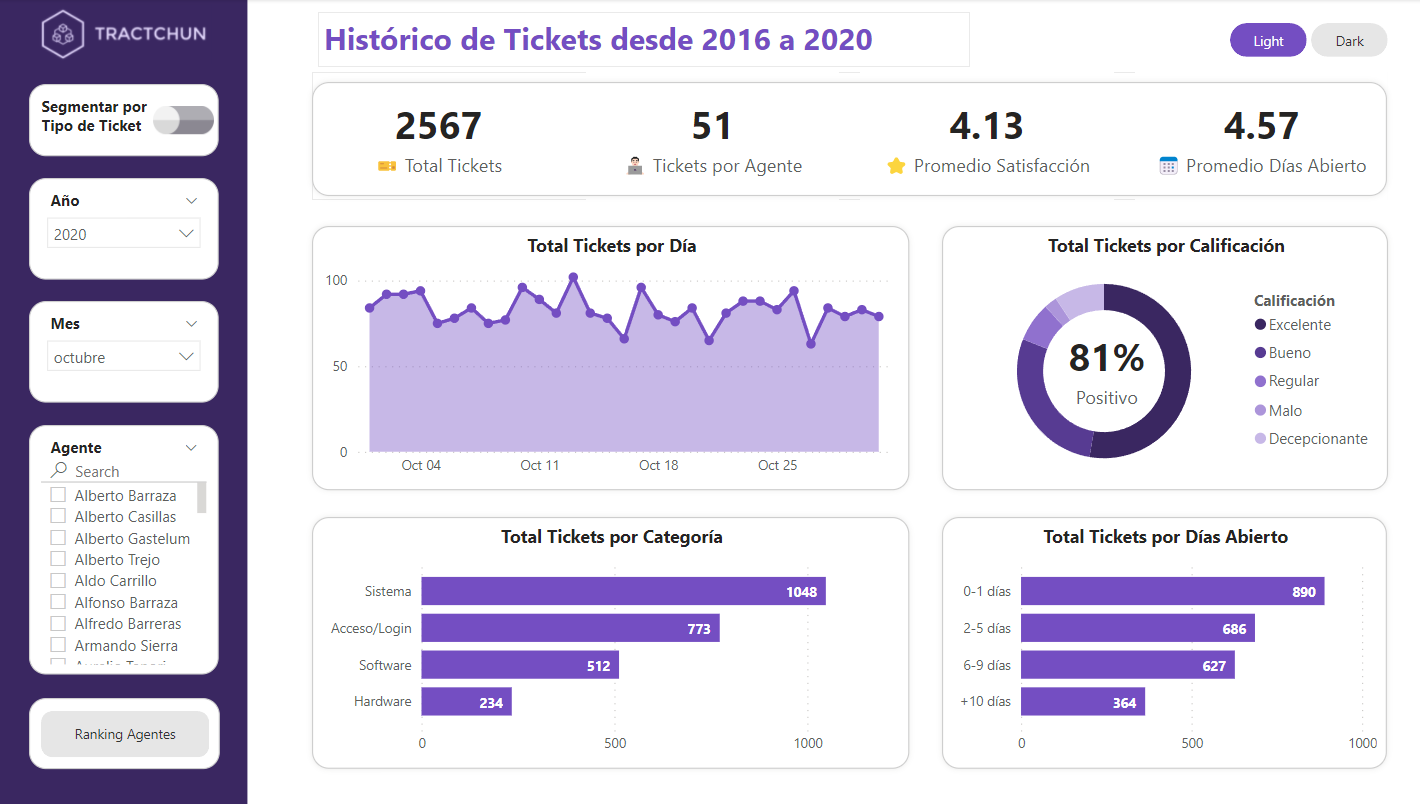
The chosen dataset is about a help desk ticket database with names, scores, dates, and much more.
Features
The dataset contains more than 20 attributes, more than 95K rows and the information is not real. All the inputs are from Jan 2016 to December 2020
We can divide all attributes in 4 groups:
- Tickets (category, date, etc)
- Level of satisfaction (rating, groups, etc)
- Employees (users of help desk ticket system)
- Calendar
- Agents (help desk employees)
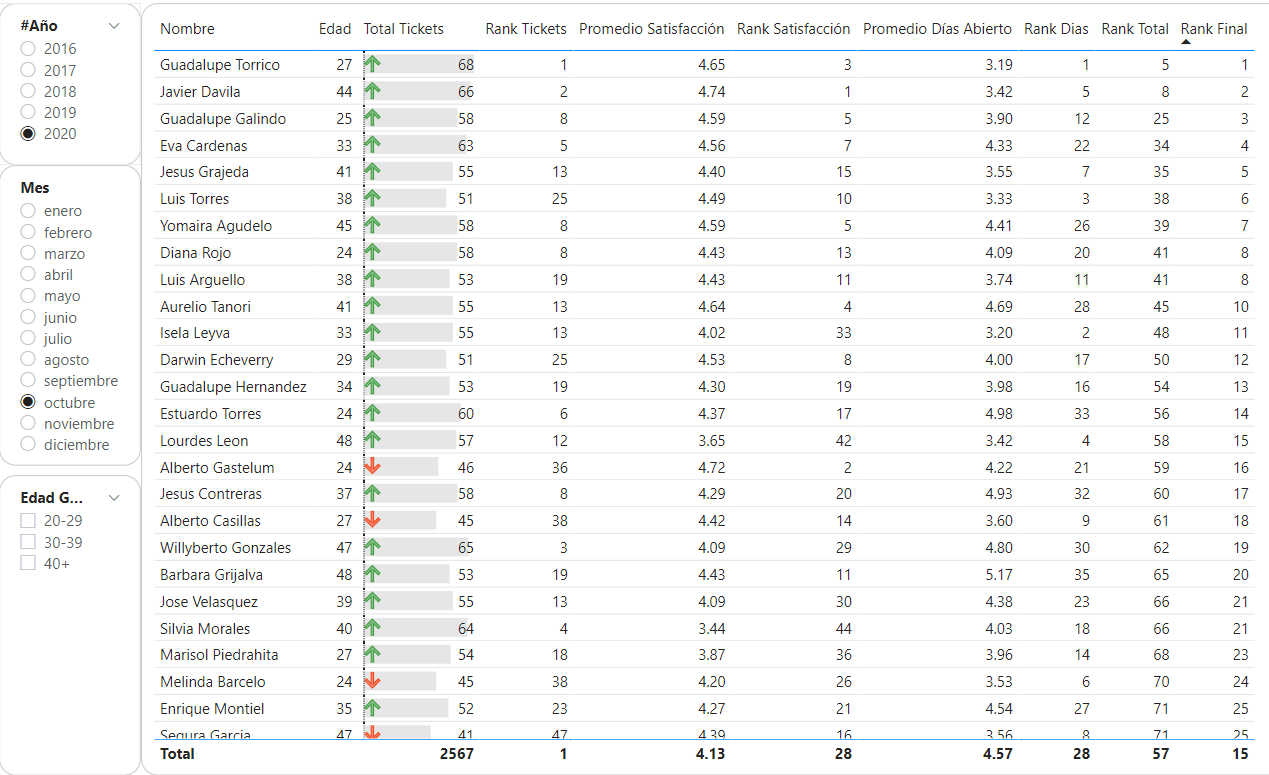
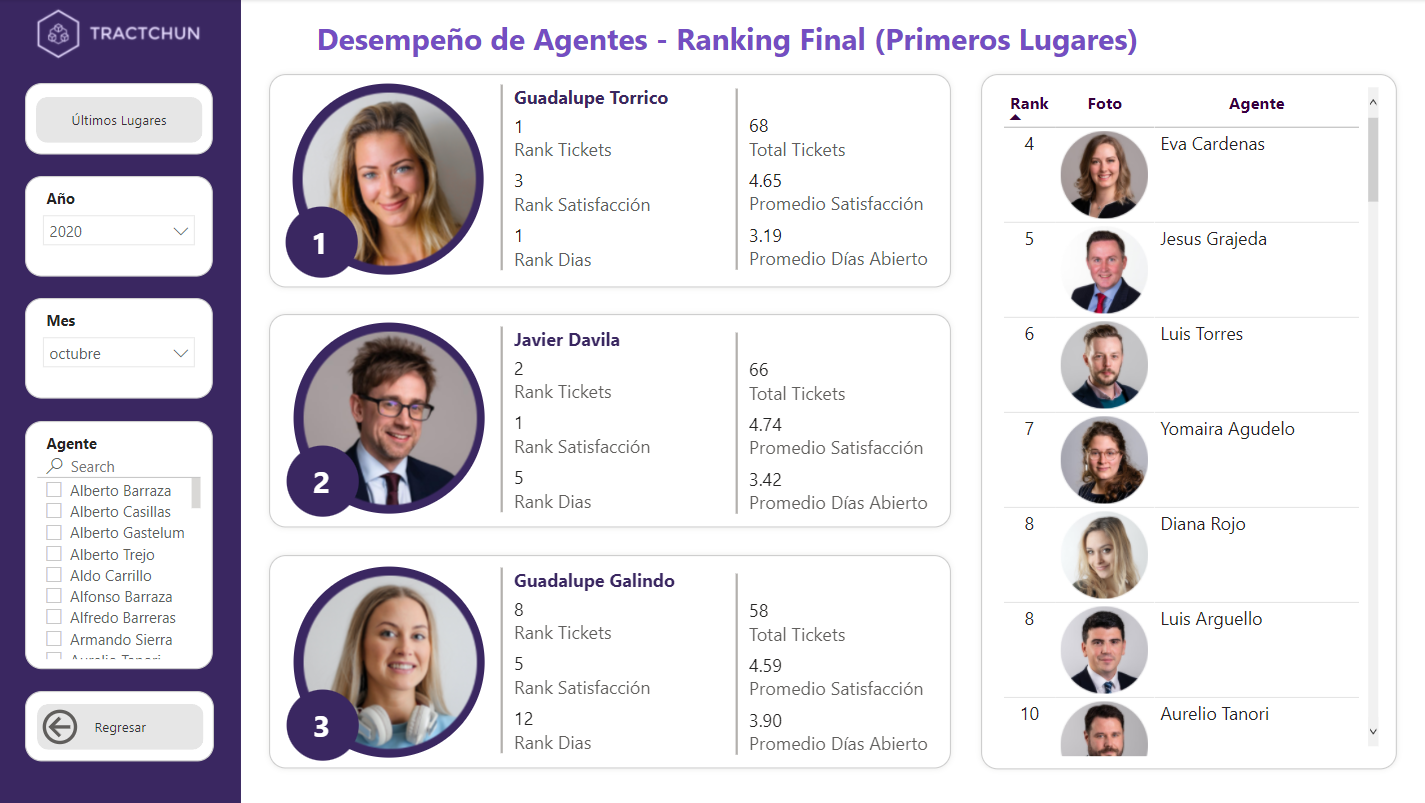
The dashboard has a total of 4 pages, dark and light mode selector, segmentations, filters, bookmarks, page navigators, measures and many more things
The first 2 pages are: tickets from 2016 and 2020 (light and dark mode)
The next 2 pages are: ranking table and a top 3 ranking with pictures and filters