About
This dataset comes from Properati Data (https://www.properati.com.ar/data/) is the data division of Properati, a real estate search site in Latin America.
The idea was to work 100% from PowerBI but I ran into difficulties (power bi is very slow for some tasks) so I decided to first clean the data with Pandas and then use PowerBI for graphics
I will be updating this page at least once a week
Topic
It contains information on online property rental or sale ads from around 2020 to 2021, it has various details such as square meters, price, region, etc.
Features
| Col | Description |
|---|
| type | Notice type (Property, Development/Project) |
| country | Country in which the notice is published |
| id | Notice identifier. It is not unique: if the notice is updated by the real estate agency (new version of the notice), a new record is created with the same id but different dates |
| start_date | Notice registration date |
| end_date | Notice cancellation date |
| place | Fields referring to the location of the property or development |
| lat | Latitude |
| lon | Length |
| l1,l2,l3,l4 | Country, province, city, neighborhood |
| operation | Type of operation (Sale, Rent) |
| type | Type of property (House, Department, PH) |
| rooms | Number of rooms (useful in Argentina) |
| bedrooms | Number of bedrooms (useful in the rest of the countries) |
| bathrooms | Number of bathrooms |
| surface_total | Total surface in m² |
| surface_covered | Surface covered in m² |
| price | Price |
| currency | Currency of the published price |
| price_period | Price Period (Daily, Weekly, Monthly) |
| title | Title of the ad |
| description | Description of the ad |
| development | Fields related to real estate development (empty if the ad is for a property) |
| status | Development status (Completed, Under construction, …) |
| name | Development name |
| short_description | Short description of the ad |
| description | Description of the ad |
Exploring and filtering data
1
2
3
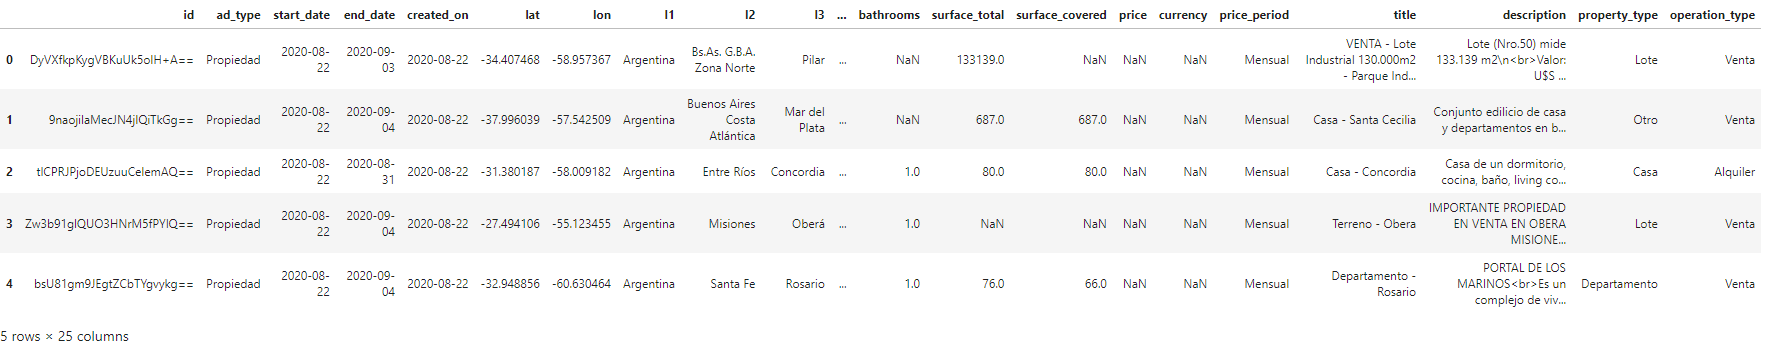
| import pandas as pd
df = pd.read_csv('ar_properties.csv')
df.head()
|
![Desktop View]()
1
2
3
4
5
6
7
8
9
10
11
12
13
14
15
16
17
18
19
20
21
22
23
24
25
26
27
28
29
30
31
32
33
| df.info()
RangeIndex: 1000000 entries, 0 to 999999
Data columns (total 25 columns):
# Column Non-Null Count Dtype
--- ------ -------------- -----
0 id 1000000 non-null object
1 ad_type 1000000 non-null object
2 start_date 1000000 non-null object
3 end_date 1000000 non-null object
4 created_on 1000000 non-null object
5 lat 894233 non-null float64
6 lon 894191 non-null float64
7 l1 1000000 non-null object
8 l2 1000000 non-null object
9 l3 965273 non-null object
10 l4 306162 non-null object
11 l5 5530 non-null object
12 l6 0 non-null float64
13 rooms 714179 non-null float64
14 bedrooms 649933 non-null float64
15 bathrooms 765122 non-null float64
16 surface_total 477831 non-null float64
17 surface_covered 487756 non-null float64
18 price 958243 non-null float64
19 currency 955491 non-null object
20 price_period 429870 non-null object
21 title 999999 non-null object
22 description 999958 non-null object
23 property_type 1000000 non-null object
24 operation_type 1000000 non-null object
dtypes: float64(9), object(16)
memory usage: 190.7+ MB
|
We have a 190MB memory usage dataframe, we will be dropping the following columns:
- ID: is not needed because it can be replaced by the dataframe index
- created_on: is the same as start_date
- L5, L6: have a lot of nulls
- title, description: has text which i will not use for this notebook
This improves memory usage about 20%
1
2
3
| df = df.drop(['title', 'description','id','created_on','l5','l6'], axis = 1)
print('memory usage: '+str(df.memory_usage().sum()//1024000)+' MB')
->>> memory usage: 148 MB # aprox. -20% memory usage
|
What is inside each column? More or less 50% float 50% text…
1
2
3
4
5
6
7
8
9
10
11
12
13
14
15
16
17
18
19
20
21
| df.dtypes
ad_type object
start_date object
end_date object
lat float64
lon float64
l1 object
l2 object
l3 object
l4 object
rooms float64
bedrooms float64
bathrooms float64
surface_total float64
surface_covered float64
price float64
currency object
price_period object
property_type object
operation_type object
|
1
2
3
4
5
6
7
8
9
10
11
12
13
14
15
16
17
18
19
20
21
22
| df.nunique()
ad_type 1
start_date 362
end_date 450
lat 389394
lon 392553
l1 4
l2 43
l3 1367
l4 1070
rooms 38
bedrooms 85
bathrooms 20
surface_total 5191
surface_covered 3370
price 20807
currency 5
price_period 3
property_type 10
operation_type 3
dtype: int64
|
Nulls for each column (%)
1
2
3
4
5
6
7
8
9
10
11
12
13
14
15
16
17
18
19
20
21
| df.isna().mean()*100).round(1)
ad_type 0.0
start_date 0.0
end_date 0.0
lat 10.6
lon 10.6
l1 0.0
l2 0.0
l3 3.5
l4 69.4
rooms 28.6
bedrooms 35.0
bathrooms 23.5
surface_total 52.2
surface_covered 51.2
price 4.2
currency 4.5
price_period 57.0
property_type 0.0
operation_type 0.0
|
Drop L4 because we can locate using L1, L2, L3, lat and lon
1
2
| df = df.drop(['l4'],axis=1)
df.head(3)
|
some dates are formated as 9999-12-31 00:00:00
1
2
3
4
5
| df['start_date'] = pd.to_datetime(df['start_date'])
df['end_date'] = pd.to_datetime(df['end_date'])
df.head(3)
ERROR: OutOfBoundsDatetime: Out of bounds nanosecond timestamp: 9999-12-31 00:00:00
|
Let’s fix it replacing 9999 by start_date YYYY :-)
1
2
| import numpy as np
df['end_date'] = np.where(df.end_date.str[:4] == '9999', df.start_date.str[:4] + df.end_date.str[4:], df.end_date)
|
Check how many unique values are present
1
2
3
4
| cat_cols = ['l1','currency','price_period', 'property_type', 'operation_type']
df.select_dtypes(include=object).columns.tolist()
(pd.DataFrame(df[cat_cols].melt(var_name='column', value_name='value').value_counts()).rename(columns={0:'qty'}).sort_values(by=['column', 'qty']))
|
| | qty |
|---|
| column | value | |
|---|
| currency | COP | 3 |
|---|
| PEN | 292 |
|---|
| UYU | 2785 |
|---|
| ARS | 214254 |
|---|
| USD | 738157 |
|---|
| l1 | Brasil | 244 |
|---|
| Estados Unidos | 892 |
|---|
| Uruguay | 15749 |
|---|
| Argentina | 983115 |
|---|
| operation_type | Alquiler temporal | 41679 |
|---|
| Alquiler | 207490 |
|---|
| Venta | 750831 |
|---|
| price_period | Diario | 11 |
|---|
| Semanal | 17 |
|---|
| Mensual | 429842 |
|---|
| property_type | Casa de campo | 2251 |
|---|
| Depósito | 7872 |
|---|
| Cochera | 13276 |
|---|
| Otro | 27837 |
|---|
| Oficina | 32390 |
|---|
| Local comercial | 45593 |
|---|
| PH | 45837 |
|---|
| Lote | 121311 |
|---|
| Casa | 245726 |
|---|
| Departamento | 457907 |
|---|
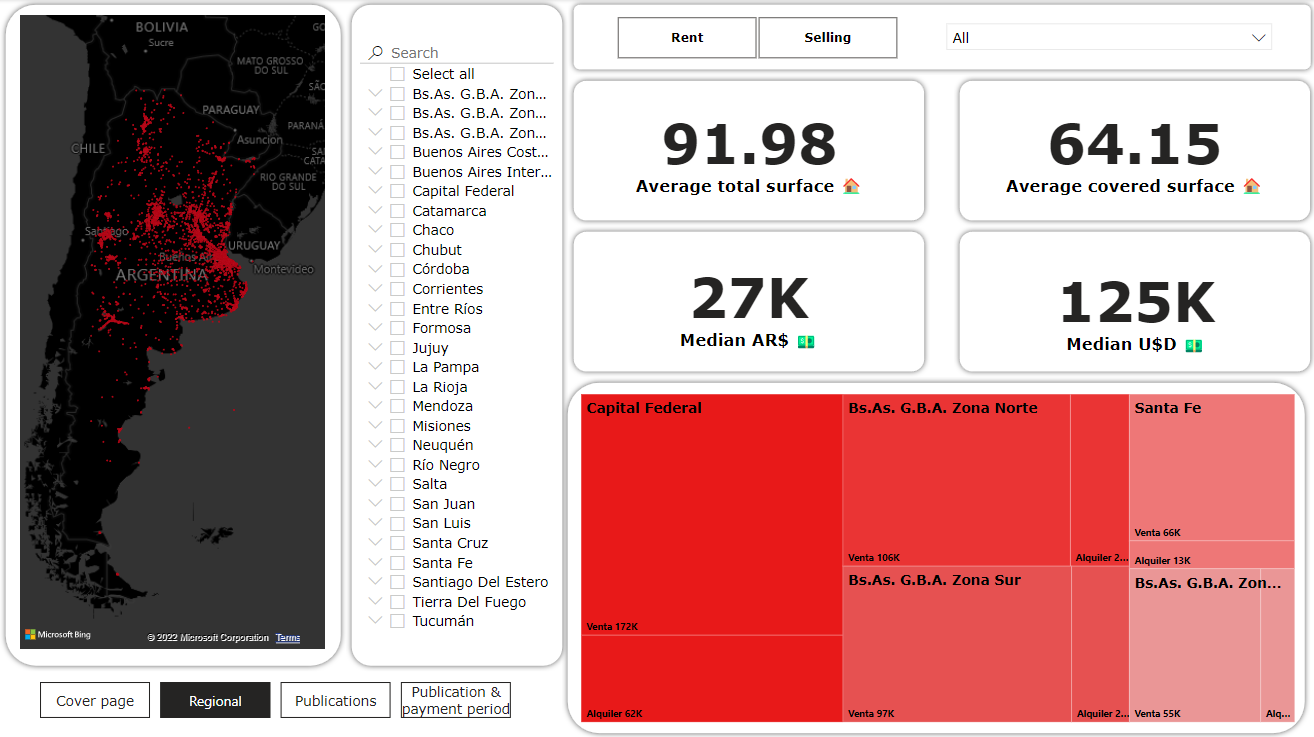
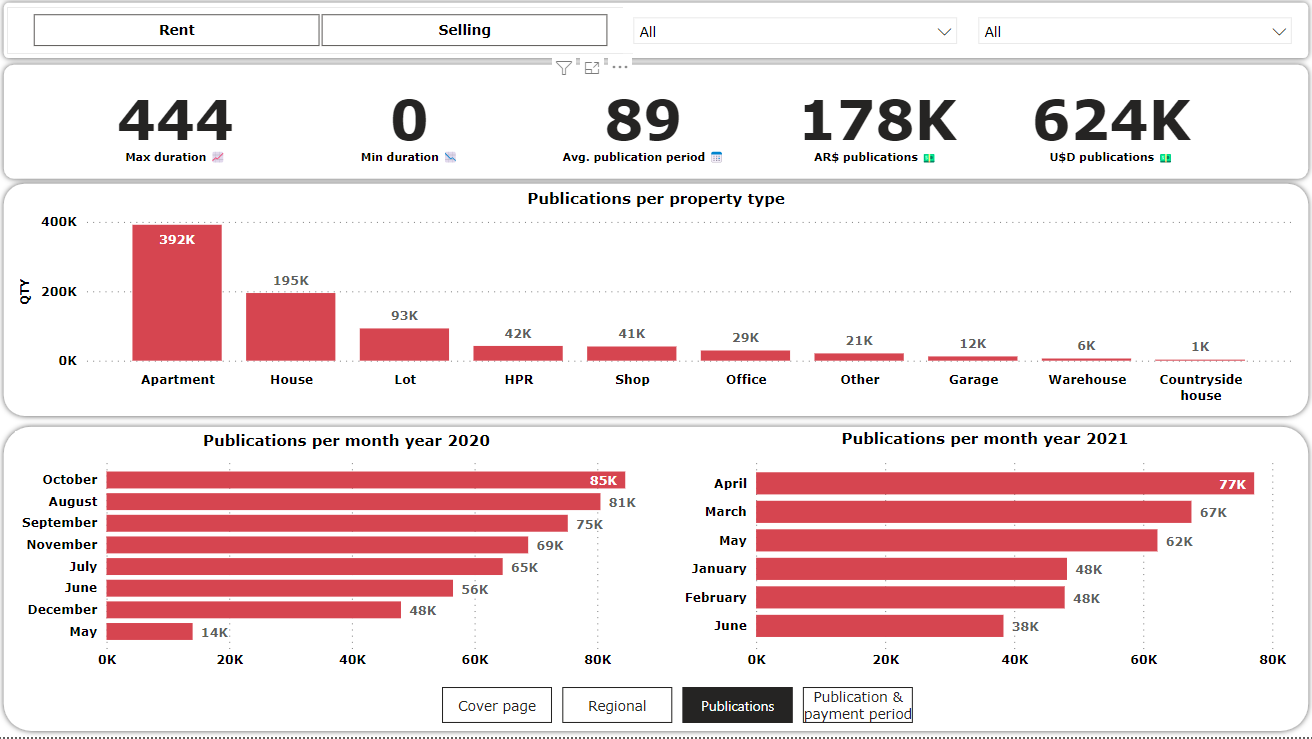
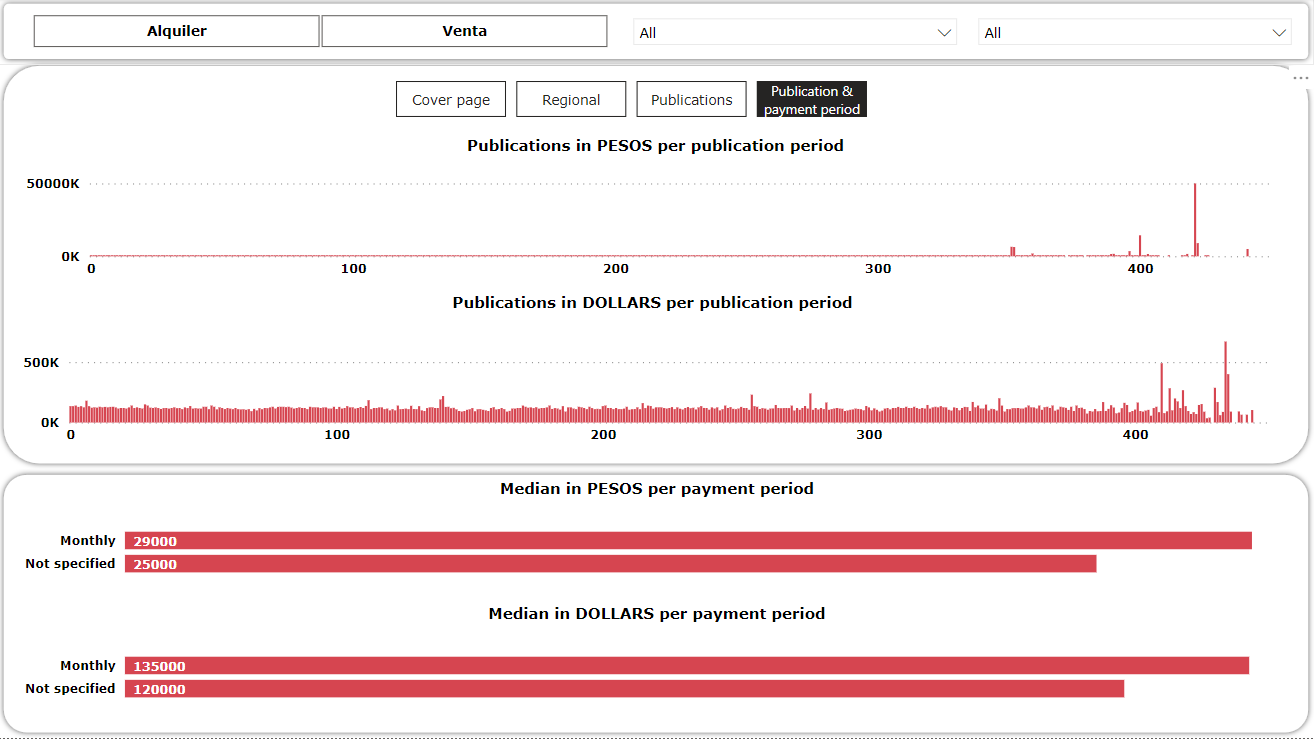
After a few days of work, here is the final dashboard! I tried to make it as simple as possible and self explanatory
The main idea was to practice the use of PowerBI after cleaning data with Pandas, i am very happy with the final result :-)